Rogue Projects
Full project management — Gantt timelines, budgets, risk registers, and real-time profitability tracking.
Rogue Projects is a standalone project management module that rivals Monday, Asana, and Smartsheet — but directly connected to your job cards, expenses, invoices, and team schedules. Track every project from planning to completion with interactive Gantt charts, real-time budget vs. actual, milestone management, and AI-powered slippage detection. Know your margin before the project closes, not after.
68% complete · 4 weeks remaining · on baseline
Site survey & scoping
Sarah K.
Procurement — long-lead items
Stockroom
Civils & foundations
Field crew A
Mechanical install
Field crew B
Commissioning & QA
Marcus T.
Handover & client sign-off
PM
Cerebrum: Mechanical install is on the critical path. Procurement for inverter brackets delivered 2 days early — buffer is healthy.
What Projects actually does
Every capability below is live in the app today — click any screenshot to expand it.
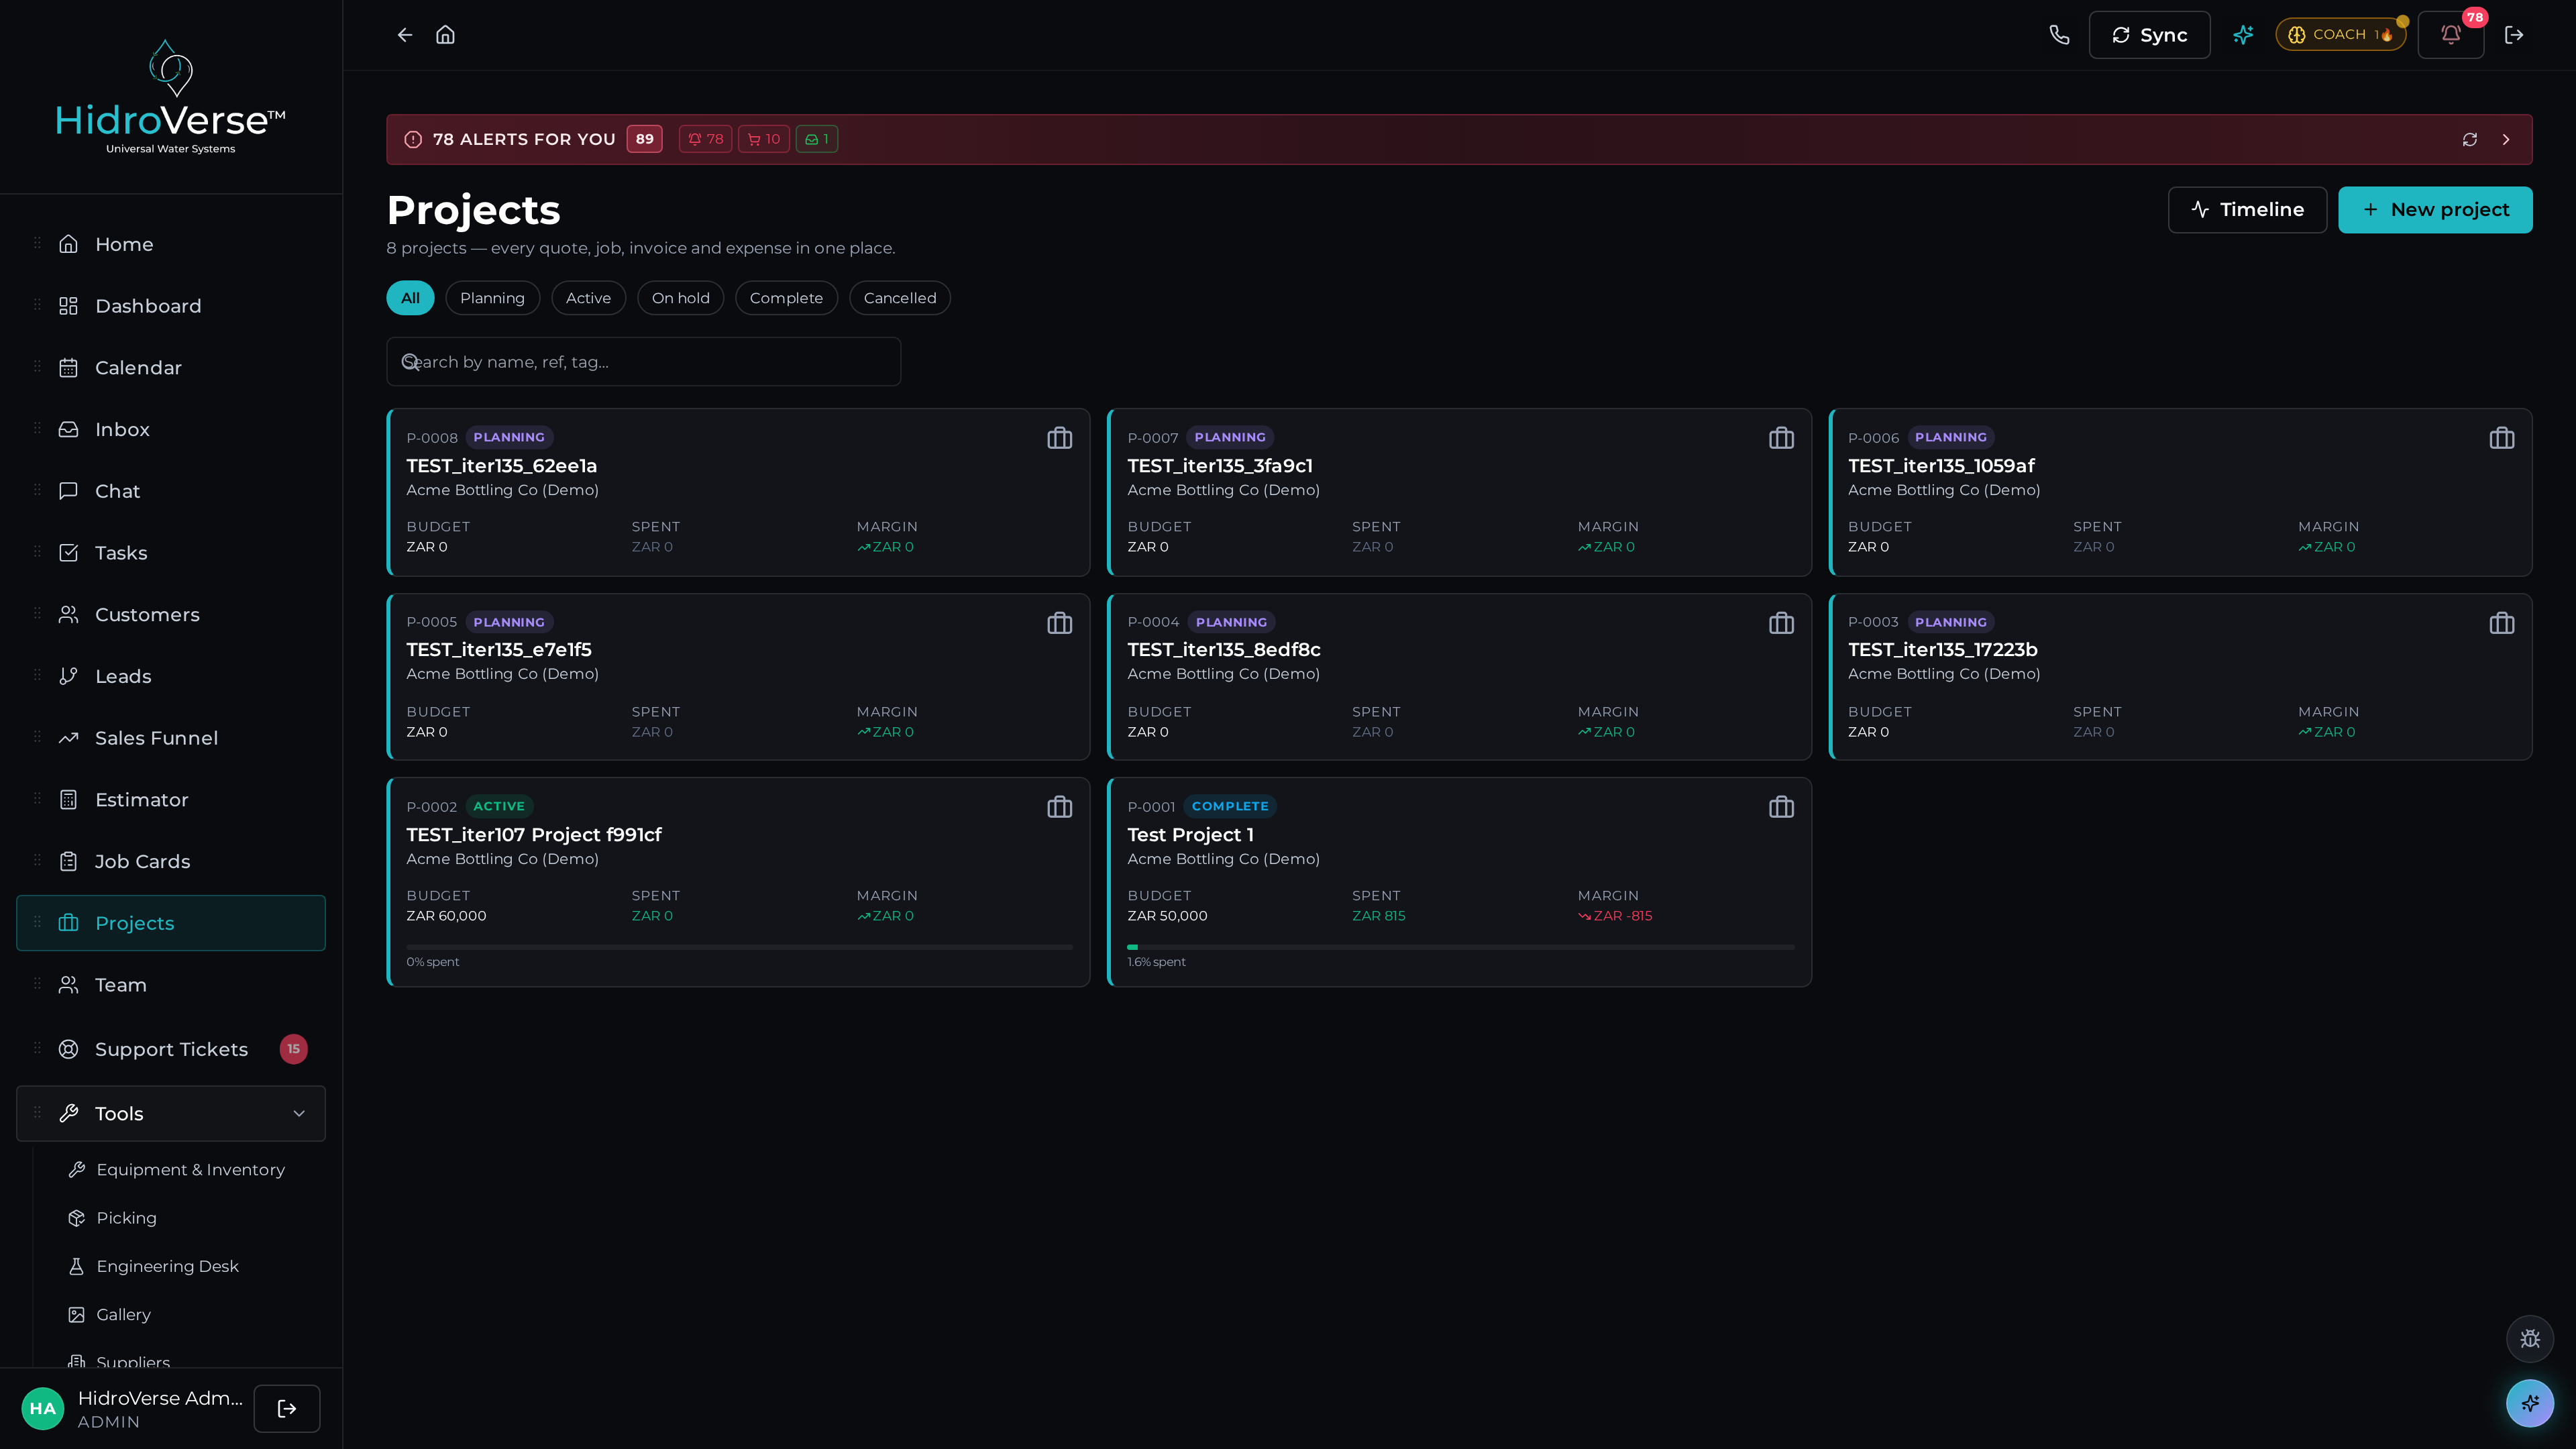
Every project at a glance — budget, margin, milestones, and team
The project dashboard shows all active projects with real-time budget tracking, spent vs. allocated, margin calculations, and phase status. Each project card surfaces the key metric that matters: is this project profitable, and is it on schedule? Click into any project for the full detail view.
- Multi-project portfolio view with status indicators
- Real-time budget vs. actual spend tracking
- Margin calculation: revenue minus all linked expenses
- Phase management: Planning → Active → Review → Complete → Archived
- Milestone tracking with deadline alerts and completion %
- Team allocation view — who's assigned to what
- Project-level notes and document attachments
Interactive Gantt that actually connects to field operations
Most project tools show pretty timelines disconnected from reality. Rogue's Gantt is connected to actual job cards, expenses, and field progress. When a job card is completed, the timeline updates. When an expense is logged, the budget bar adjusts. Drag tasks to reschedule, set dependencies, and track the critical path.
- Interactive drag-and-drop Gantt chart
- Task dependencies with critical path visualisation
- Baseline comparison showing planned vs. actual progress
- Connected to job cards — field completions update the timeline
- Connected to expenses — costs reflect in real time
- Team workload view across all projects
- Filter by project, team member, date range, or status
- Automated slippage alerts sent to project managers
68% complete · 4 weeks remaining · on baseline
Site survey & scoping
Sarah K.
Procurement — long-lead items
Stockroom
Civils & foundations
Field crew A
Mechanical install
Field crew B
Commissioning & QA
Marcus T.
Handover & client sign-off
PM
Cerebrum: Mechanical install is on the critical path. Procurement for inverter brackets delivered 2 days early — buffer is healthy.
Know your project profit before it closes — not three months later
Every project has a live P&L statement. Revenue from invoices and quotes flows in. Expenses, labour costs, and procurement spend flow out. The margin is visible in real time, and Cerebrum flags projects at risk of going negative before it's too late.
- Live profit & loss per project
- Revenue tracking from linked invoices and quotes
- Expense tracking with OCR receipt scanning
- Labour cost calculation from job card hours
- Procurement spend from linked purchase orders
- Margin alerts when projects approach break-even
- Exportable financial summaries per project
Automated risk detection — Cerebrum watches your projects 24/7
Cerebrum runs slippage detection on a scheduled basis, comparing actual progress against planned timelines. Risk registers track identified risks with mitigation plans. When a project is falling behind, alerts are pushed to managers before the client notices.
- Automated slippage detection against baseline timelines
- Risk register with severity, likelihood, and mitigation tracking
- Scheduled monitoring with push notifications
- Procurement radar: what's needed, when, from which supplier
- Purchase order generation directly from project requirements
- Cross-project resource conflict detection
Cerebrum AI inside Projects
Cerebrum monitors every project continuously: it detects timeline slippage against baselines, predicts margin outcomes based on current burn rates, generates procurement recommendations for upcoming phases, flags cross-project resource conflicts, and produces weekly project health summaries for managers and stakeholders.
Pricing for Projects
Per user/month, or get all 8 modules with the All Rogue package.
Starter
1–5 users
$ 9/user/mo
$ 5
per user/mo — first 3 months
Growth
6–15 users
$ 15/user/mo
$ 8
per user/mo — first 3 months
Business
16–50 users
$ 24/user/mo
$ 12
per user/mo — first 3 months