
Run the physical world from a browser tab.
Geminii Nexus is a real-time control platform for the operations that keep critical systems alive — water, power, mining, manufacturing, built environment. Connect any sensor on any protocol across any distance. Drag live gauges, pump controls, and flow meters onto a canvas built by the operator, not a consultant. Author safety logic in plain English. Let the platform act on its own when the operation can't wait for a human.
Telemetry latency
Sub-second
Node to operator
Long-range mesh
15 km+
Per LoRa hop
Offline runtime
Indefinite
Edge buffered
Protocols
Universal
Modbus · 4-20 mA · Pulse · Serial
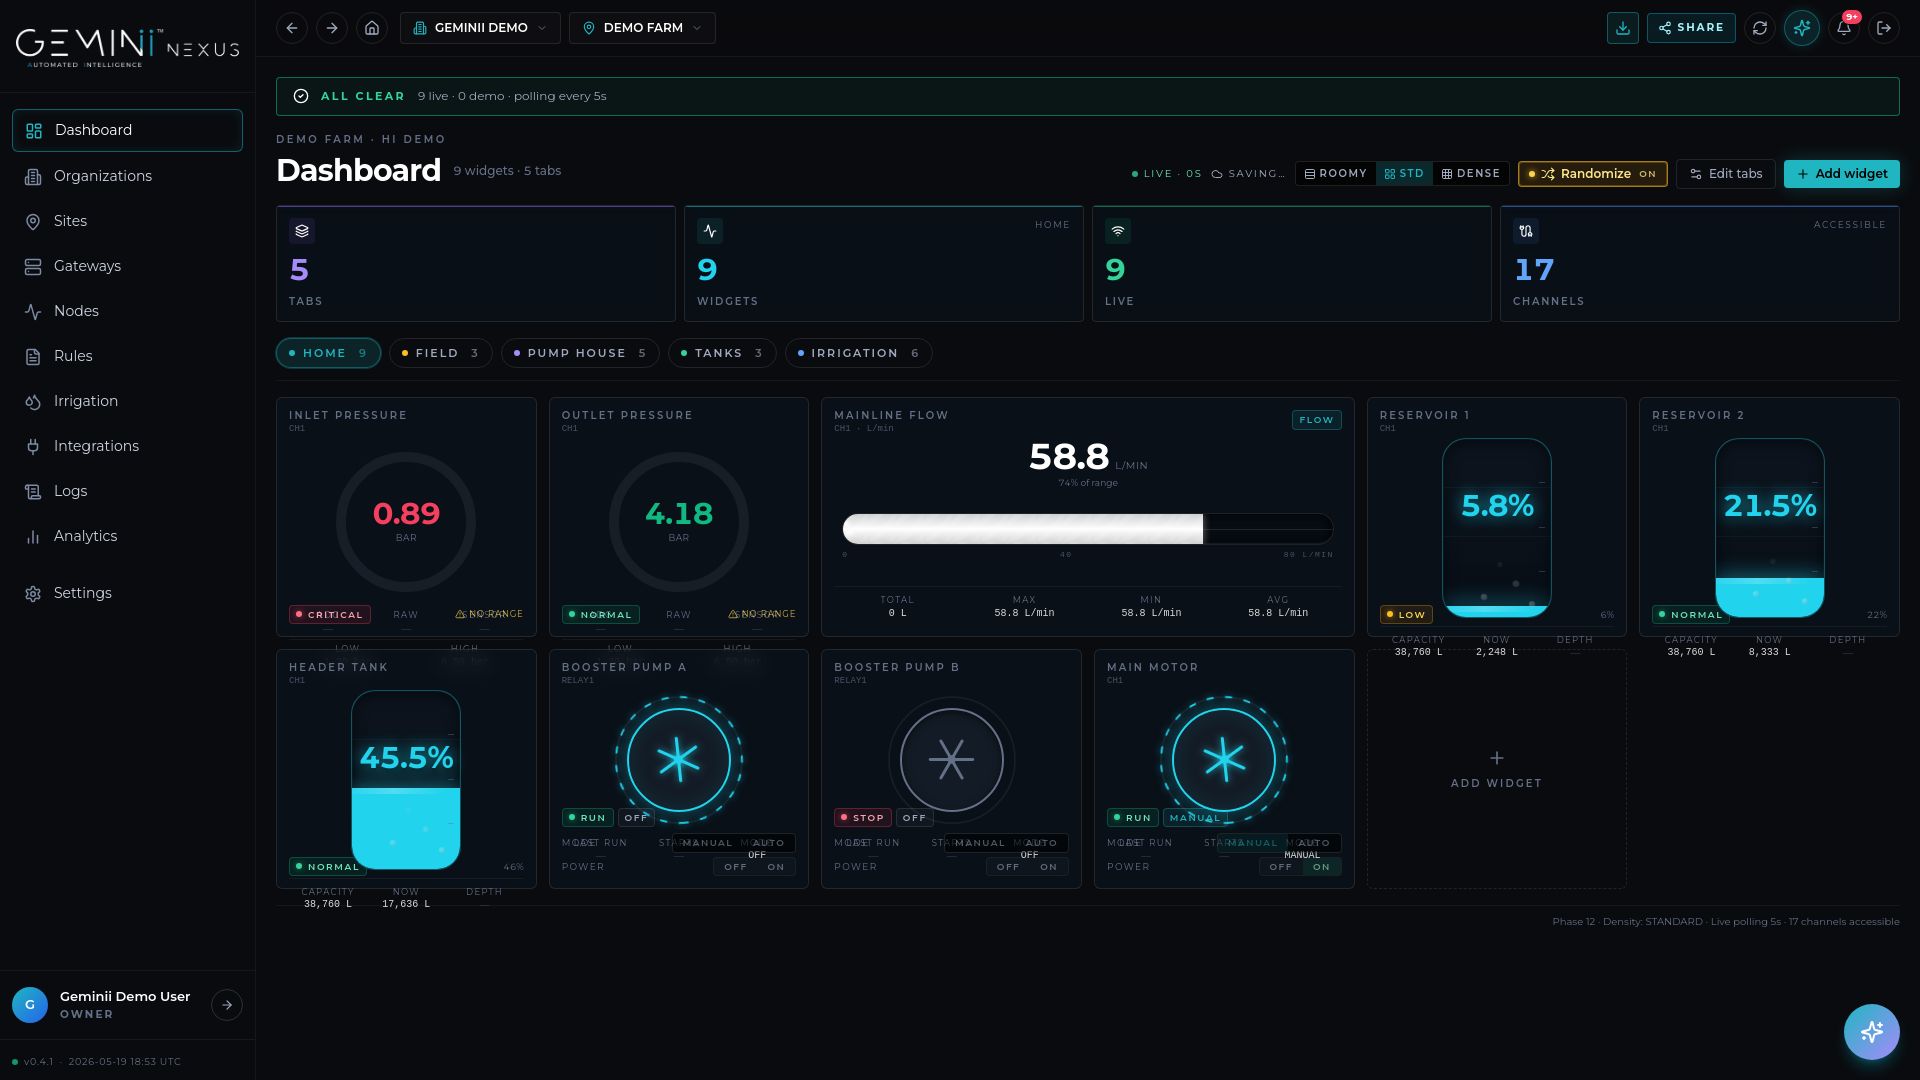
A canvas the operator builds — and runs.
Tabs for every area of the operation. Live channels polling every five seconds. Gauges, tanks, flow meters, and pump controls on a single screen. Density toggles for the operators who want it dense and the executives who want it roomy.
Channels
Unlimited
Every sensor, every signal, every site — no licence ceiling.
Canvas
Yours to shape
Tabs, widgets, density — composed by the operator, not a consultant.
Alerts
Instant action
Live alert state in the top bar; one click to acknowledge, one rule to resolve.
Navigation
All sites, one menu
Customisable sidebar across every organisation, site, and gateway.
Eight screens. One operating picture.
Browse the views operators use every day — the live dashboard, the rules engine, the node and gateway fleet, the irrigation overview, the integration library, and the multi-tenant org switcher. Click any frame to enlarge.
Pick the industry. See exactly how it runs on Geminii Nexus.
The platform is one stack — the application of it is unique to every operation. Open any industry below for the typical assets, the sensor stack, the rule patterns, and the analytics outputs operators in that sector run every day.
Water & wastewater
Municipal utilities, farming operations, bottling plants, and dosing facilities run Nexus as the live brain across the pipework. Tank levels, pump health, leak signatures, and chlorine dosing all flow into the same canvas — with rules that act before the operator's phone rings.
Typical assets
- Reservoirs, header tanks, sumps, balance tanks
- Booster pumps, transfer pumps, dosing pumps
- Pressure-reducing valves, motorised actuators
- Flow meters at abstraction, line, and outlet points
- Chlorine, pH, turbidity, conductivity probes
Sensor stack
- Level (radar, hydrostatic, ultrasonic)
- Pressure (4–20 mA transmitters, line and discharge)
- Flow (mag, mechanical, pulse counting)
- Water quality (pH, EC, ORP, turbidity, residual chlorine)
- Motor current, vibration, run-hours
Example rules
- Tank-low → start backup pump, alert supervisor, log to compliance
- Discharge pressure climbing while flow steady → flag blockage, schedule strainer clean
- Chlorine dose drifts > 0.5 ppm from setpoint → pause line, escalate
- Bore aquifer drawdown > daily limit → enforce abstraction quota
Analytics outputs
- Daily volumes by source, by line, by customer
- Energy per kilolitre — pump efficiency drift over time
- Non-revenue water signature analysis from balance vs delivery
- Compliance reports — chlorine and pH residuals, sampled & exported
Bring the team in. Keep the right hands on the right channels.
The owner sets the perimeter; admins build out the operation; operators watch and act; technicians fix; analysts learn from it; clients see only what's been shared with them. Every role has its own scope across organisations, sites, gateways, and dashboards — and every action is signed into the audit log.
Owner
Full control of the organisation — billing, branding, sub-org provisioning, role assignment, and audit access. One per tenant, typically the operations director or business owner.
- Billing & subscription
- Org branding & sub-domain
- Role catalogue
- Audit log access
- API key issuance
Administrator
Day-to-day platform management. Adds users, builds sites, provisions gateways and nodes, configures rules, and curates the dashboard library.
- User invitations & role bindings
- Site & gateway lifecycle
- Rule authoring & publication
- Dashboard sharing
- Integration setup
Operator
The control-room user. Reads every channel, acknowledges alarms, executes guarded control commands, and curates personal tab layouts.
- Read-all channels
- Alarm acknowledgement
- Guarded control commands
- Personal tab editing
- Shift-handover reports
Technician
Field-focused. Sees the assets they're rostered to, marks devices as in-maintenance, applies firmware updates, and closes work orders linked to alarms.
- Scoped device view by assignment
- Maintenance mode toggle
- OTA firmware deployment
- Alarm-linked work orders
Analyst
Read-only across the data plane plus Analytics. Composes reports, builds export pipelines, and asks Nexi for cross-site insights.
- Read-only channels & history
- Report builder & scheduler
- Data warehouse export
- Nexi analytical queries
Client / viewer
External stakeholders — landlords, regulators, agronomists, or board members. Sees only the dashboards explicitly shared with them, with read-only access.
- Shared dashboards only
- No control commands
- No data export
- Branded sub-tenant view
Geminii Demo · Owner
6 active members · 4 active sites
J. Marais
Owner
A. Theron
Administrator
S. Pillay
Operator
R. Dlamini
Technician
K. Vermeulen
Analyst
E. Louw
Client
Invite by email · scope per site · revoke instantly
From the asset to the operator — in milliseconds.
Every layer is engineered so the operation keeps running when one of them blinks.
Sensors
Pressure · Flow · Energy
Nexus Node
I/O + Scripting + Radio
Nexus Gateway
Aggregation + Edge logic
Geminii Cloud
Tag DB + Rules + AI
Operator
Browser · Mobile · API
Built for the operations that can't go offline.
Every architectural choice is biased toward continuity, latency, and operator authority. The platform is fast, opinionated, and runs without supervision.
Universal signal capture
Every industrial protocol, every analog standard, every digital bus — ingested by a single node and unified into the same channel database.
Long-range, multi-protocol mesh
LoRa, cellular, Wi-Fi, GNSS — pick the right radio per site, mix radios per asset, scale beyond 10 km with repeaters where the geography demands it.
Operates without an uplink
Nodes execute control logic locally and buffer telemetry when the cloud is unreachable. The plant keeps running; the cloud catches up the moment the link returns.
Autonomous logic at every tier
Hard interlocks live on the node. Cross-asset rules live on the gateway. Site-wide intelligence lives in the cloud. Latency goes where the decision needs to be.
Operator-built widget canvas
Tabs, widgets, density modes, and live channels — composed by the people who actually run the operation. Drag a gauge onto the canvas, bind it to a channel, save the tab. Done.
AI co-pilot built in
Plain-English queries, conversational rule authoring, generated reports, and ranked risk findings — every screen has a co-pilot that understands the live operation.
Every channel, live. Every five seconds.
A streaming channel database keeps every reading flowing to every widget. Alarms prioritise themselves, acknowledge with a click, and audit themselves into a tamper-proof timeline.
Site · Springbok pump house
Reservoir 03
71.4%
Bore pump-A
6.47bar
Line flow
187.1L/min
Motor draw
21.2A
Active alarms
3 unacknowledgedDischarge pressure above 7.8 bar setpoint
Level falling at 2.4 %/min — projected empty in 18 min
Cellular RSSI degraded to -97 dBm; failover armed
Charge current below daily baseline by 12%
Tabs. Widgets. Channels. Built by the operator.
Spin up a tab for every area of the operation — Field 3, Pump House 5, Tanks. Drag a pressure gauge, a flow meter, a tank visual, a pump control onto the canvas. Bind each to a live channel. Toggle the canvas between Live, Roomy, Standard, and Dense — the same screen serves both the control room wall and the operations director's laptop.
- Multi-tenant data model — organisations, sites, gateways, nodes, channels
- Widget library — gauges, tanks, flow meters, pump controls, KPIs, history charts
- Density toggles — LIVE / ROOMY / STD / DENSE for every viewer
- Channel bindings — CH1 pressure, RELAY1 pump state, no integration tax
A canvas. A widget library. Done.
Gauge
72%
Trend
Trend
Alarms
3
2 high · 1 medium
Uptime · 7 d
99.6%
Energy by site · today
An AI co-pilot for the people in the control room.
Conversational rule authoring, ranked risk findings, anomaly explanations, and generated reports — all reasoning over the same live tag stream the dashboards render. Operators ask in plain English; the platform answers with data, charts, and recommended actions.
Describe the intent. The platform writes the rule.
Operator intent
"If reservoir-03 falls below 20% and pump-A has been idle for 90 seconds, open bypass valve-B, alert the on-call engineer, and log to compliance."
Compiled logic preview
WHEN
  reservoir_03.level < 20%
  AND pump_a.state == "off" FOR 90s
THEN
  valve_b.open()
  notify(role: "on-call", channel: ["sms","whatsapp"])
  audit.compliance("low-level-bypass")
Back-test · 30 d
3 fires
All correct
False positives
0
Status
Ready
What is the biggest risk on the Northern Cape sites right now?
Pump-A at Aggeneys is the highest-priority risk. Discharge pressure has trended up 14% over 48 hours while motor draw is steady — pattern matches the partial-blockage signature seen in 2024-Q4. Recommended action: schedule strainer inspection within 12 hours.
Confidence
High
Asset
Pump-A
Window
12 h
Conversational rule authoring
Describe a control intent in natural language and the platform compiles it into a deterministic rule. The rule is back-tested against the past 30 days of telemetry before it can go live — every trigger and every action visible before activation.
Risk and anomaly intelligence
Ask, in plain English, what is most at risk across a fleet, a site, or a single asset. The platform inspects live and historical telemetry, weighs every relevant signal, and replies with ranked findings and recommended actions.
Auto-generated reporting
Shift handovers, compliance reports, executive summaries — written by the platform from raw telemetry, formatted to brand, and scheduled to the right recipients. Hours of manual analysis collapsed into a click.
Predictive maintenance signals
Drifting bearings, leaking seals, climbing draws, flapping sensors — the platform learns asset baselines and surfaces deviations before they become outages.
Wireless. Wired. Whatever the site demands.
A field with one strong cellular bar and a plant with thick concrete walls need different radios. Nexus runs all of them. Mix protocols within a single gateway. Reach across kilometres of bush with a LoRa repeater chain. Failover to cellular the moment the primary link blinks.
Low-power wide-area mesh for remote field assets
LTE-M / NB-IoT / 4G for unattended sites
High-bandwidth links between dense local nodes
Geolocation, geofencing, and asset tracking
Pick the right radio per asset.
A single gateway can run multiple radios. Mix protocols on the same site — short-range mesh indoors, long-range LoRa outdoors, cellular failover everywhere.
Off-grid by design, mains-friendly by choice.
Field nodes ship in three power profiles — pick the one the site supports.
Sleep-cycle firmware for years of unattended runtime.
Mains-independent at remote, off-grid sites.
Plant-floor friendly with surge isolation and brown-out tolerance.
Every protocol on the plant floor. One tag database.
A single node ingests legacy serial, modern industrial buses, analog standards, and digital I/O — and presents them as the same first-class tags.
Modbus RTU / TCP
Talk to existing PLCs, VFDs, energy meters, and BMS controllers.
RS-485 / RS-232
Native serial bus access for legacy instrumentation.
4 – 20 mA analog
The industrial backbone — pressure, flow, level, temperature transmitters.
0 – 10 V analog
HVAC, building automation, drive references.
Pulse counting
Flow meters, energy meters, rotary encoders, throughput counters.
Dry contact / digital I/O
Limit switches, relays, valve states, contactor feedback.
I²C / SPI / 1-Wire
Direct interface to digital sensor packages and edge probes.
Custom drivers
Onboard scripting hooks let any proprietary protocol be added.
Built for fleets. From the first site.
A multi-tier data model means a single tenant can scale from one pump house to a national fleet without re-architecting. Permissions, branding, and dashboards travel with the hierarchy.
Tier 1
Organisation
A tenant. Brand it, permission it, white-label it. The Geminii Nexus header carries the org name as the operator's home.
Tier 2
Site
A physical location with one or more gateways, its own tabs, and its own widget canvas. Pump House. Substation. Field 3.
Tier 3
Gateway
An on-premise edge appliance that aggregates nodes and runs cross-asset rules locally — independent of the cloud.
Tier 4
Node
A field device with multiple inputs and outputs. Every CH (channel) and every RELAY flows through it.
Tier 5
Channel
A single addressable measurement — pressure on CH1, flow on CH2, pump state on RELAY1 — sampled, stored, alarmed, and acted upon.
Stop bouncing between tabs.
External APIs flow into the same dashboards as the telemetry — weather, tariffs, maps, ticket systems, identity providers, warehouses. The control room becomes the single pane of glass.
Weather APIs
real-time and forecast feeds into rule logic
Power utility tariffs and demand windows
Mapping & GIS providers for site visualisation
Asset registers and CMMS
Maximo, SAP PM, Fiix, UpKeep
Messaging
Email, SMS, Slack, Microsoft Teams, WhatsApp
Ticketing
Geminii Rogue Support, Jira Service Management, Zendesk
Identity
Microsoft Entra ID, Google Workspace, Okta SSO
Data warehouses
Snowflake, BigQuery, Azure Data Lake
Bring the operation online.
A live demo tenant is open to the public — no signup, no credentials, just the platform running on a real dataset. Step inside before talking to anyone.